China’s Storage Build Recovered in Q3. CNESA Says the Returns Did Not.
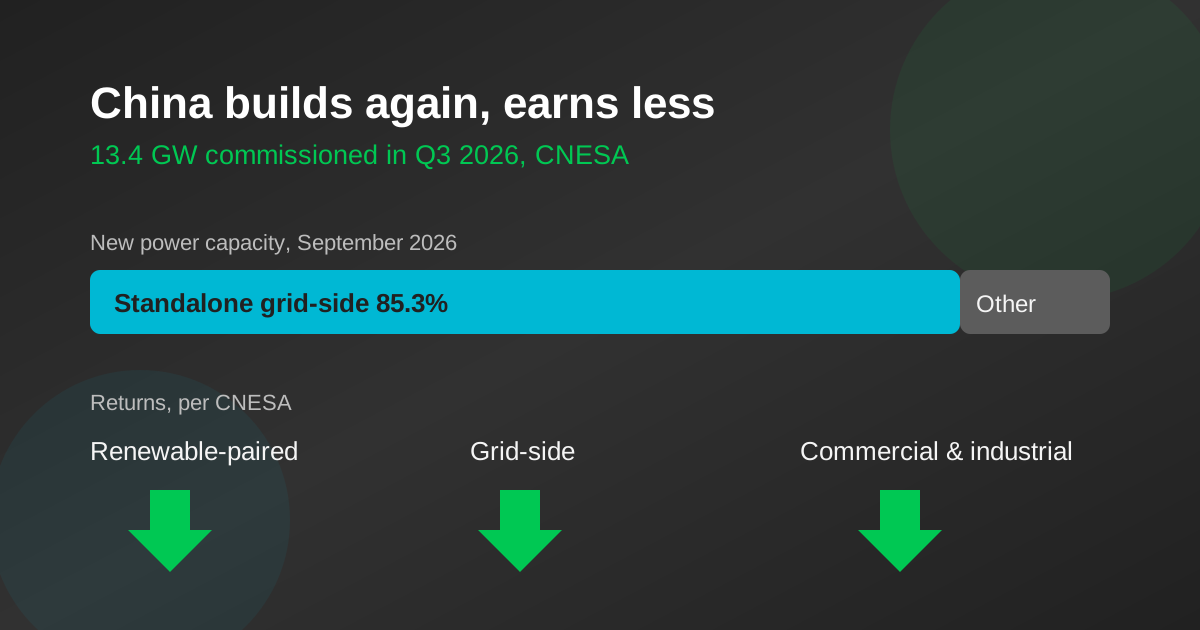
China commissioned 13.4 GW of new-type storage in the third quarter, CNESA counts, almost all of it standalone grid-side. In the same week CNESA warned that returns are shrinking in all three main segments, including commercial and industrial storage, as fixed peak-to-off-peak spreads narrow.
Published: 20 November 2026
Grid storage · 3 min read
What happened
Written 20 November 2026, on two China Energy Storage Alliance (CNESA) analyses published on 14 and 15 October, and SMM’s report of 30 October on Xinjiang’s storage capacity price.
China’s storage build recovered in the third quarter. CNESA counts 13.4 GW and 43.0 GWh of new-type storage commissioned in July to September, the first quarter above 10 GW, after a first half in which installations fell by more than 15 per cent year on year for the first time. Over the nine months the total was 35.30 GW and 102.31 GWh, roughly level with the whole of 2025.
In the same week CNESA published a second analysis with a blunter message: returns are shrinking in all three of the market’s main segments. The two pieces together describe a market that is building again but has not yet worked out how it gets paid.
Who is building
The recovery is almost entirely grid-side. In September, CNESA reports, standalone grid-side storage was 3.70 GW and 12.29 GWh, 85.3 per cent of the month’s new power capacity and up 112 per cent year on year. Storage paired with solar and wind grew more slowly. Storage at customer sites showed a “downward trend”, and commercial and industrial (C&I) systems made up 95.7 per cent of that customer-side build.
Lithium iron phosphate was 73.08 per cent of September’s new power capacity, with non-lithium long-duration storage, such as compressed air and flow batteries, at 23.6 per cent.
Why returns are shrinking
CNESA gives a different cause for each segment:
- •Paired with renewables: the end of mandatory pairing has weakened developers’ incentive, and existing income “cannot cover capital and operational expenses”
- •Standalone, grid-side: income from leasing capacity to renewable developers, once over half of revenue in some provinces, “has sharply fallen following policy adjustments”, and capacity tariffs do not yet close the gap
- •Customer-side, mostly C&I: the end of administratively set time-of-use price bands narrows the fixed peak-to-off-peak spread a battery earns from, lengthening payback
The capacity tariffs that are meant to fill the gap are set province by province. SMM reports, for example, that Xinjiang is keeping its standalone storage capacity price at RMB 165 per kW per year, alongside peak-shaving subsidies and price spreads. CNESA notes that Jiangsu, which led September’s build by energy, has yet to launch its spot market and capacity compensation rules formally.
A C&I battery lives on the gap between the dearest and cheapest hour. When a tariff reform narrows that gap, the same battery earns less, however well it is built. That is what CNESA says is happening to China’s customer-side storage.
CNESA’s six recommendations include moving end users towards spot-linked tariffs, national compensation for emergency dispatch, long-term capacity agreements for long-duration storage, payment for grid-forming services, and lifecycle safety standards tied to market access.
What it means for this business
Wingzman sells C&I battery storage in India, where a system earns from time-of-day tariffs and demand charges. China’s experience is a useful warning rather than a forecast:
- •C&I storage economics depend on tariff design, so a business case should be tested against a narrower peak-to-off-peak spread than today’s
- •Savings that do not depend on one spread, such as cutting demand charges or replacing diesel backup, are more robust
- •China’s grid-side recovery is built on capacity payments; India’s viability gap funding plays a similar role for grid storage, but not for storage behind a factory meter
For how tariff design drives a battery’s savings in India, see time-of-day tariffs and battery storage and peak shaving in our glossary. For Beijing’s new plan to put storage on a market footing, see China’s 300 GW storage plan.
Sources
Reporting this piece draws on. Figures were correct as published; scheme terms and commodity prices move.
- China’s New Energy Storage Installations Catch Up With 2025 Levels In First Three Quarters; Long-Duration Non-Lithium Storage Projects See Concentrated CommissioningChina Energy Storage Alliance (CNESA) · 14 October 2026
- Three Major Application Segments See Shrinking Returns — Can China’s New Energy Storage Resolve Its Profitability Bottleneck?China Energy Storage Alliance (CNESA) · 15 October 2026
- China: Xinjiang Maintains 165 RMB/kW·year Capacity Price for Standalone StorageShanghai Metals Market (SMM) · 30 October 2026
Terms in this article
Frequently asked questions
How much storage did China install in the first nine months of 2026?+
CNESA counts 35.30 GW and 102.31 GWh of new-type storage commissioned from January to September 2026, roughly level with all of 2025. The third quarter alone was 13.4 GW and 43.0 GWh, after a first half in which installations fell year on year for the first time.
Why does CNESA say storage returns in China are shrinking?+
For storage paired with renewables, the end of mandatory pairing weakened the incentive to build. For standalone grid-side storage, income from leasing capacity has fallen and capacity tariffs do not yet close the gap. For commercial and industrial storage, the end of fixed time-of-use price bands narrows the peak-to-off-peak spread a battery earns from.
What is the lesson for commercial battery storage in India?+
C&I storage economics depend on tariff design. A business case should be tested against a narrower peak-to-off-peak spread than today’s, and savings that do not rest on one spread, such as cutting demand charges or replacing diesel backup, are more robust.
Is storage right for your site?
Send us a month of electricity bills and your load profile, and we will tell you what a battery would save — including when it would not pay.