Why North India’s Air Collapses Every Winter — and What Electrification Actually Fixes
The emissions barely change in November. The air does. A plain explanation of temperature inversion, the stubble burning distraction, why transport is the largest local source, and an honest table of what swapping a combustion vehicle does and does not fix.
Published: 20 August 2026
Environment · 11 min read
The same three months, every year
Between roughly the middle of October and the middle of February, air quality across the Indo-Gangetic plain deteriorates on a schedule you could set a calendar by. It is tempting to read that regularity as evidence of a single seasonal cause. It is not. What changes in winter is mostly the ventilation, not the emissions.
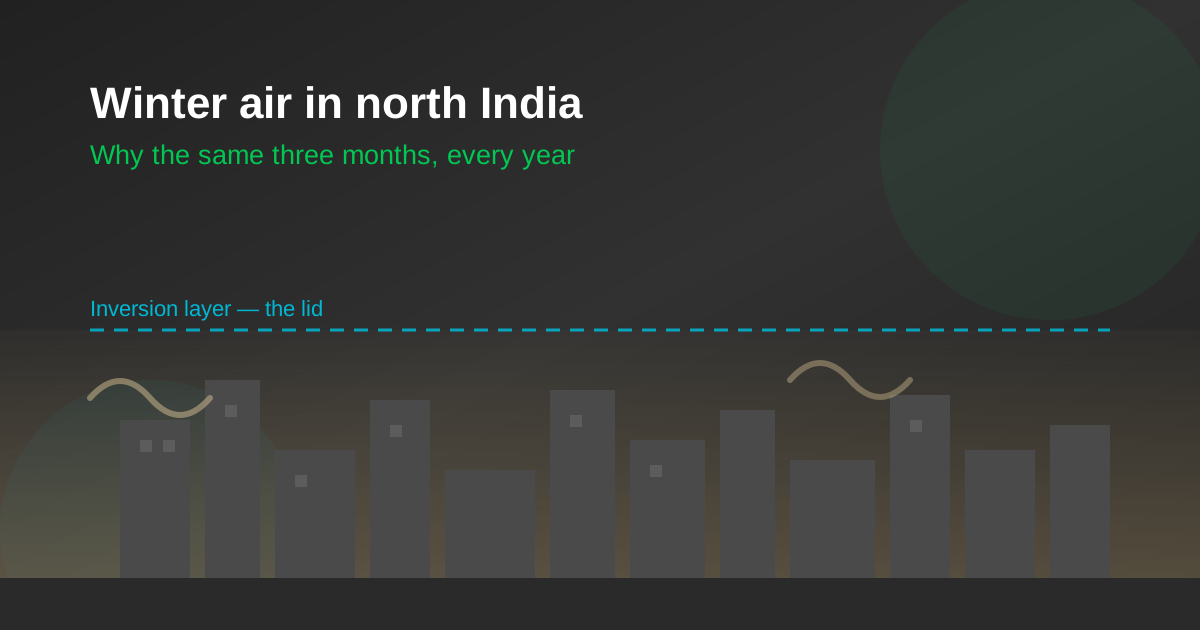
Three things happen together. The mixing layer — the depth of atmosphere that pollution disperses into — collapses from a couple of kilometres on a summer afternoon to a few hundred metres on a still winter morning. Temperature inversion puts a lid of warm air above cold surface air, so nothing rises through it. And wind speeds drop, so nothing moves sideways either.
The same quantity of smoke, dust and exhaust released into a tenth of the volume of air gives you roughly ten times the concentration. That is the entire mechanism. Emissions that are survivable in June are lethal in December because the air stops carrying them away.
The 2025–26 winter was worse, not better
This matters because the trend line is going the wrong way. Analyses of the October-to-February 2025–26 season found average PM2.5 concentrations across the region materially higher than the winter before, with seasonal averages around 91 µg/m³ against a national annual standard of 40, and peak daily readings above 390 µg/m³ at the onset of winter. On 17 and 18 January 2026, PM2.5 in Delhi crossed 320 µg/m³ — roughly double the same dates a year earlier.
It is also not a Delhi story. Of 238 Indian cities assessed for that winter, the large majority failed to meet the permissible annual limit for fine particulate matter, with Ghaziabad and Noida frequently worse than Delhi itself. The capital gets the headlines because it has the monitors and the press corps.
What is actually in the air
PM2.5 is not one substance. It is a size class — particles under 2.5 microns across, small enough to pass the nose and throat and reach deep into the lung. What matters for policy is where those particles come from, and they arrive by two quite different routes.
- •Primary particles are emitted directly as particles: soot from incomplete combustion in diesel engines and biomass fires, dust lifted from roads and construction sites, fly ash from industry.
- •Secondary particles form in the atmosphere from gases. Nitrogen oxides from engines and sulphur dioxide from fuel combustion react with ammonia — much of it from agriculture — to form nitrate and sulphate aerosols. In a cold, humid, stagnant winter atmosphere this chemistry runs faster, which is why secondary particles are a larger share of the winter load than the summer one.
The practical consequence is that you cannot fix winter air by controlling only what comes out of chimneys and exhaust pipes as visible smoke. A significant fraction of the particle mass was invisible gas when it left the source.
Stubble burning is real, and it is a distraction
Paddy residue burning in Punjab and Haryana genuinely does contribute, and on a handful of days in late October and early November, with the wind blowing the right way, it contributes enormously — enough to dominate the daily figure.
But the fires end in November and the smog does not. Analyses of the season repeatedly find that Delhi’s air gets worse in December and January, after the burning has finished. Averaged across the full winter, crop fires are a minority contributor; on many days in the burning window itself, the modelled contribution is in the low single digits of percent.
Stubble burning is an episodic source layered on top of a structural one. It is politically convenient because it is somebody else’s fault and it goes away on its own. The structural sources do not go away, and they are local.
Transport is the largest local source
Source apportionment is contested territory and the numbers vary by method, by year and by which boundary you draw. But across studies the direction is consistent: once you set aside long-range transport and look only at what is emitted inside the city and its immediate surroundings, the transport sector is the single biggest contributor to PM2.5.
The Decision Support System used for Delhi attributes something in the region of 45 per cent of local PM2.5 emissions to transport. Within the primary particle fraction specifically, vehicles come out at around 40 per cent, and some analyses of local emissions alone put the vehicle share above half. Treat any single figure with caution — the honest summary is “the largest single local source, by a clear margin, and rising with vehicle population.”
Two features of the transport contribution make it particularly difficult. It is emitted at street level, in the volume of air people actually breathe, rather than from a stack a hundred metres up. And it grows structurally with vehicle registrations, so a fleet that gets cleaner per vehicle can still emit more in aggregate.
What electrification actually fixes
It is worth being precise here, because both the enthusiasts and the sceptics overstate their case. Replacing a combustion vehicle with an electric one removes some emissions completely, reduces others, and does nothing at all about several.
| Source | Effect of electrification |
|---|---|
| Tailpipe soot and NOx | Eliminated at the vehicle. This is the direct, street-level, breathing-height fraction, and it is also the source of the NOx that becomes secondary nitrate later. |
| Diesel generator backup | Eliminated where a battery system replaces the genset. Standby diesel is a large and badly regulated urban source, and it runs hardest exactly when the grid is stressed. |
| Brake wear particles | Substantially reduced. Regenerative braking does most of the deceleration, so friction pads are used far less. |
| Tyre and road wear | Not reduced, and marginally worse for a heavier vehicle. This is a real and growing share of traffic-related particles. |
| Road dust resuspension | Unchanged. Any vehicle stirs up settled dust. This is a paving, sweeping and construction-management problem, not a powertrain problem. |
| Construction and industry | Unchanged, other than any industrial diesel displaced. |
| Biomass burning for heat and cooking | Unchanged by vehicle policy. A significant winter source in the periphery, and one that peaks on exactly the coldest, stillest nights. |
| Upstream generation | Shifted, not removed — moved from street level to a power station, which is better for exposure but still emits until the grid decarbonises. |
Read down that table and the fair conclusion is this: electrification is the most effective available lever on the largest local source, and it is not sufficient on its own. Anyone claiming it solves the problem is wrong. So is anyone claiming it does not help.
GRAP is a brake, not a cure
The Graded Response Action Plan works by escalating restrictions as air quality worsens — construction halts, certain vehicle categories are barred, diesel generator use is curtailed, schools shift online. It is an emergency measure and it functions as one: it shaves the top off the worst episodes.
What it cannot do is change the annual average, because it is only active on the bad days and it stops the moment the wind picks up. Every year the same sequence runs — a curtailment in November, a debate in December, a rainstorm in January that clears the air and the conversation with it.
The other winter problem: your battery is cold too
There is a symmetry worth noting for anyone running an electric fleet. The same weather that traps the pollution also degrades the vehicles fighting it.
Lithium chemistry slows down in the cold. Internal resistance rises, usable capacity falls, and a pack that gave 90 kilometres in October may give 75 in January — not because it has aged, but because it is cold. Charging is the more serious constraint: charging a lithium-ion cell below about 0°C plates metallic lithium on the anode, which causes permanent damage, and a competent BMS will refuse the charge until the pack warms.
For most of India this is a nuisance rather than a crisis, but in the north it is a real operational planning issue in December and January. Our guide on seasonal range variation covers what to expect and how to manage it, and the daily battery check is worth doing more carefully in the cold months.
What actually moves the number
If you are asking what a city, a fleet operator or a facility manager can do that changes the winter average rather than the winter headline, the honest list is short and unglamorous.
- •Electrify the vehicles that run the most hours. A commercial three-wheeler covering 100 kilometres a day displaces roughly ten times the emissions of a private car covering ten. Duty cycle, not vehicle count, is what matters.
- •Remove the standby diesel. Backup generators are a concentrated urban source and are usually replaceable by a battery system that also earns its keep the rest of the year by shaving demand charges.
- •Pave, sweep and manage construction dust. Deeply boring, consistently underfunded, and one of the few interventions that acts directly on the resuspension fraction.
- •Attack the biomass fraction with heating and cooking access, not enforcement. People burn refuse at 4 a.m. in January because they are cold.
- •Fund the monitoring. You cannot apportion what you do not measure, and most of the argument about who is responsible is downstream of thin data.
None of this is fast. But the reason the same three months look identical every year is that the sources are structural, and structural problems only respond to structural answers — which, unlike an emergency curtailment, keep working after the wind changes.
Frequently asked questions
Why does north Indian air get so bad specifically in winter?+
Mostly because the air stops moving, not because emissions rise. The mixing layer — the depth of atmosphere pollution disperses into — collapses from a couple of kilometres in summer to a few hundred metres on a still winter morning, a temperature inversion puts a lid of warm air above the cold surface air, and wind speeds drop. The same emissions released into a fraction of the air volume give you a multiple of the concentration.
How much of Delhi’s pollution is actually stubble burning?+
On a handful of days in late October and early November, with the wind in the right direction, a great deal. Averaged across the full October-to-February season, a minority — and on many days during the burning window itself the modelled contribution is in the low single digits of percent. The decisive evidence is that Delhi’s air typically gets worse in December and January, after the fires have finished.
What share of Delhi’s PM2.5 comes from vehicles?+
Estimates vary by method and year, but the direction is consistent. The Decision Support System used for Delhi attributes roughly 45 per cent of local PM2.5 emissions to transport; within the primary particle fraction specifically vehicles come out around 40 per cent, and some analyses of local emissions alone put the share above half. The honest summary is that it is the largest single local source by a clear margin.
Do electric vehicles actually help with air pollution?+
Yes, on part of the problem. They eliminate tailpipe soot and the NOx that later becomes secondary nitrate, they cut brake wear because regenerative braking does most of the deceleration, and where a battery system replaces a standby diesel generator they remove a concentrated urban source. They do nothing about road dust resuspension, tyre wear, construction dust or biomass burning for heat, and upstream generation emissions are moved rather than removed.
Why does GRAP not fix the problem?+
Because it is an emergency measure that activates on bad days and stops when the wind picks up. Escalating construction halts, vehicle restrictions and generator curtailment shave the top off the worst episodes, which is worth doing, but they cannot move the seasonal average. That requires acting on the structural sources — which are local, and mostly transport, dust and combustion.
Thinking about upgrading?
Talk to our team about the right pack for your vehicle, and about EMI options that keep the monthly outgo close to what you already spend.
Get in touch