The Charging Station Money Problem: Why the Maths Only Works Above a Certain Utilisation
Half your capital buys a transformer and a concrete pad, not a charger. A worked example showing why a site is loss-making at 5 per cent utilisation and pays back in three years at 20 — and what buffer storage does to the demand charge that decides it.
Published: 20 August 2026
Finance · 12 min read
The business everyone assumes is a licence to print money
The pitch is easy to believe. Electric vehicle sales are rising, every one of them needs energy, and a charging station sells energy at a markup to a growing captive market. Land is available, equipment is available, subsidy is available. What could go wrong?
What goes wrong is that a charging station is a fixed-cost business being asked to survive on a variable-revenue line, and for most Indian sites today that variable line is far below the level at which the fixed costs are covered. The reliability problems described in our piece on why public chargers do not work are mostly symptoms of this. Nobody services an asset that is losing money.
What you are actually buying
The first surprise for most people entering this business is how little of the capital goes into the thing they thought they were purchasing.
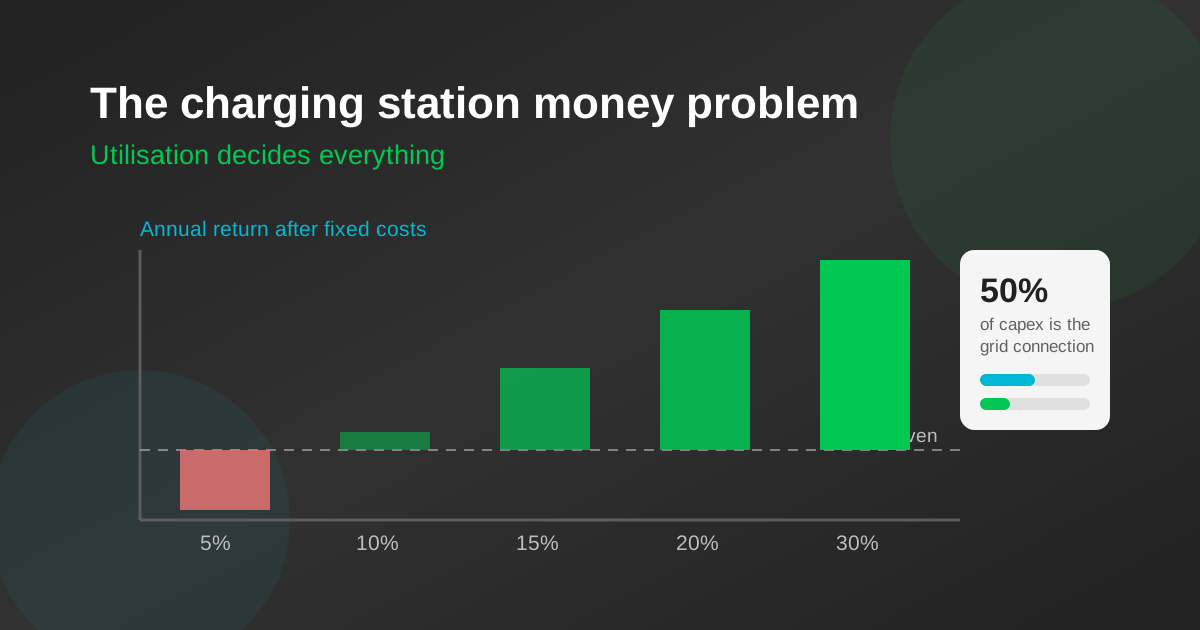
Avendus’ illustrative model of a full-specification public station meeting the Ministry of Power’s requirements — a mix of AC and DC units including 100 kW fast chargers — puts total capital expenditure at around ₹60 lakh, and notes that obtaining the electricity connection, building the electrical infrastructure and doing the civil works can account for up to half of that.
Read that again, because it is the single most important fact in charging economics. Up to fifty per cent of your capital buys a transformer, a cable run, a switchgear room, a concrete pad, a canopy and a set of approvals. None of it can be moved if the location turns out to be wrong, and none of it can be resold. The charger itself — the part with a brand on it — is the liquid, relocatable minority of the investment.
Revenue is three numbers multiplied together
Strip out the complexity and the revenue line of a charging site is:
Installed kW × hours actually delivering × gross margin per kWh
You choose the first at the time of purchase. You negotiate the third within a narrow band — typically ₹8 to ₹16 per kWh between what you buy energy for and what you can charge for it. The second is decided by the market, and it is the one that determines whether the business exists.
Utilisation here means the share of the 24-hour day the charger spends actually delivering at rated power. It is a demanding definition — 10 per cent utilisation means the equivalent of two hours and twenty-four minutes of continuous full-power delivery every single day, including Sundays. Indian private operators average well under 25 per cent and report many sites under 10.
A worked example, and the cliff in the middle of it
Take a single-charger site: one 60 kW DC unit, roughly ₹18 lakh all-in including the connection, cabling, civil works and commissioning. Assume a gross margin of ₹10 per kWh and annual fixed costs of about ₹4.5 lakh — site rent, demand charges on a 70 kVA sanctioned load, a share of manpower and security, connectivity, software subscription and a maintenance provision.
| Utilisation | Units sold per day | Gross margin per year | After fixed costs | Simple payback |
|---|---|---|---|---|
| 5% | 72 kWh | ₹2.6 lakh | −₹1.9 lakh | Never — it loses money |
| 10% | 144 kWh | ₹5.3 lakh | ₹0.8 lakh | About 23 years |
| 15% | 216 kWh | ₹7.9 lakh | ₹3.4 lakh | About 5.3 years |
| 20% | 288 kWh | ₹10.5 lakh | ₹6.0 lakh | About 3.0 years |
| 30% | 432 kWh | ₹15.8 lakh | ₹11.3 lakh | About 1.6 years |
Illustrative only. Your equipment cost, tariff, rent and state incentives will move every line.
Notice the shape. This is not a business where returns improve gradually with volume. Between 5 and 15 per cent utilisation you go from structurally loss-making to a five-year payback, and by 30 per cent you are into returns that would look attractive in almost any sector. The entire decision rests on which side of roughly 12 to 15 per cent your site lands, and that is a question about footfall at a specific address — not about chargers, subsidy or technology.
The demand charge trap
There is a specific mechanism that makes low utilisation worse than it first appears, and it catches nearly everyone.
Commercial electricity in India is billed in two parts: an energy charge per unit consumed, and a demand charge levied on your sanctioned or maximum recorded load in kVA, every month, regardless of whether you used it. A 60 kW charger obliges you to contract for roughly 70 kVA. You pay for that contract whether you sell 400 units in a day or four.
Expressed per unit sold, the effect is savage. In the example above, the demand charge component works out at roughly ₹6.40 for every kWh sold at 5 per cent utilisation — against a gross margin of ₹10. At 20 per cent utilisation the same fixed charge spreads across four times the volume and costs about ₹1.60 per kWh. The tariff did not change. The business did.
Several states cap or waive demand charges for public charging stations, and the Ministry of Power’s guidelines constrain the tariff distribution companies may levy on charging stations. Check your state’s current tariff order before modelling anything — this single line item can swing a site from viable to hopeless, and the treatment varies materially across states. Our note on how to check state EV policies explains where to look.
Buffer storage changes the capital structure, not just the bill
Putting a battery between the grid connection and the chargers addresses both halves of the problem at once, and it is the reason charging and stationary storage are converging businesses.
A 60 kW charger running at 10 per cent utilisation moves 144 kWh in a day. That energy could be drawn from a 20 kW connection running for eight hours into a buffer battery, and then delivered to vehicles in short high-power bursts from the battery. The vehicle still sees 60 kW. The distribution company sees 20.
- •The sanctioned load falls from around 70 kVA to around 25 kVA, cutting the monthly demand charge by roughly two-thirds — the single largest fixed cost at low utilisation.
- •The connection capital cost falls, often sharply, because a smaller service may not require the transformer upgrade that was going to consume half the project budget.
- •Sites that were simply not feasible become feasible. Where the local network cannot sanction 70 kVA at any price or on any timeline, a buffered site can be built anyway.
- •The battery can arbitrage. Charge on off-peak tariff, deliver during the day, and the spread adds to gross margin rather than sitting idle.
- •Against all of that: the buffer is real capital and it has a finite cycle life. It pays where the connection is expensive, slow or capped — not everywhere.
The arithmetic is the same one a factory runs when it installs storage to cut its maximum demand, which we set out in peak shaving and demand charges, and the sizing question — how many kW versus how many kWh — is covered in sizing a C&I battery system.
Subsidy changes the arithmetic, not the business
PM E-DRIVE supports a substantial share of fast-charger capital cost — up to half for public fast chargers, less for residential units — conditional on uptime commitments around 95 per cent and on OCPP compliance. State policies layer further incentives on top, and together these can cut effective capital cost dramatically and pull payback in by years.
This is genuinely valuable and it should be pursued. But it is worth being clear about what it does and does not do. Subsidy reduces the numerator of the payback calculation. It does not create traffic at your site, it does not pay your demand charge next month, and it does not service your debt. A site that cannot cover its fixed operating costs from gross margin is not rescued by a capital grant — it simply loses money on a smaller investment.
Note also that the uptime condition is a genuine obligation with a cost attached. Ninety-five per cent availability requires spares, a technician and a monitoring system. Budget for it in the operating line, because the alternative is failing the condition.
Why lenders are cautious, and what that means for your rate
It is instructive to compare a charging station with the energy assets that banks are comfortable financing.
A solar farm gets funded because a long-term power purchase agreement obliges a known counterparty to buy a modelled quantity of output at a fixed price for twenty-five years. As we traced in the history of energy finance, the lender is really underwriting that contract rather than the equipment.
A charging station has no such contract. Its revenue is uncontracted, discretionary footfall at a single address, in a market where the customer base is growing but the competitive position of any one site is not defensible. There is no offtaker to underwrite. That is why charging infrastructure typically attracts shorter tenures and higher rates than generation assets of similar size, and why the structure that has grown fastest is not project debt at all.
- •Charging as a Service moves the site host from capital expenditure to operating expenditure. The service provider funds and owns the hardware on its own balance sheet and takes a fee or a share of revenue; the host provides the location, the connection and the footfall.
- •It is a sensible allocation. The provider can spread equipment risk across many sites and knows what a charger costs to maintain. The host is the only party who genuinely understands their own footfall.
- •It is not free. Over a high-utilisation asset’s life, a revenue share costs more than owning outright. The trade you are making is certainty for upside — which is the right trade if you are unsure about utilisation, and the wrong one if you are confident.
- •Captive and fleet depots break the model in a good way. A depot charging a known fleet on a known schedule has something close to a contracted offtake, which is why depot charging finances more easily than public charging and why fleet operators are building it first.
Five questions before you commit capital
- •What is the honest utilisation forecast for this address, in kWh per day, and what is it based on? If the answer is a market growth rate rather than an observation about this location, you do not have a forecast.
- •What does the connection actually cost and how long does it take? Ask the distribution company before you sign the lease, not after. This is half your capital and most of your delay risk.
- •How are demand charges treated for public charging in this state today, and is that treatment time-limited?
- •Who fixes it at 9 p.m. on a Sunday, what does that cost per year, and is it in the model? If it is not, the model is wrong and the asset will end up in the non-functional statistics.
- •What breaks the business — a competing site 500 metres away, the anchor tenant leaving, a tariff revision? Price the downside case, because the gap between 8 per cent and 15 per cent utilisation is the gap between a write-off and a good investment.
If you are financing the equipment rather than paying cash, the number to compare across offers is the all-in annual percentage rate including every charge, not the headline interest rate. Our EMI calculator converts a quoted flat rate into its reducing-balance equivalent and shows the effective APR.
Frequently asked questions
How much does it cost to set up an EV charging station in India?+
An illustrative full-specification public station meeting the Ministry of Power’s requirements, with a mix of AC and DC units including 100 kW fast chargers, comes to around ₹60 lakh. The critical detail is that obtaining the electricity connection, building the electrical infrastructure and doing the civil works can account for up to half of that — capital that cannot be moved or resold if the location turns out to be wrong.
Is an EV charging station profitable in India?+
It depends almost entirely on utilisation, and the relationship is a cliff rather than a slope. On an illustrative single 60 kW site costing about ₹18 lakh with ₹10 per kWh gross margin and ₹4.5 lakh of annual fixed costs, 5 per cent utilisation loses money outright, 10 per cent pays back in around 23 years, 15 per cent in about 5 years and 20 per cent in about 3. The whole decision rests on whether a specific address clears roughly 12 to 15 per cent.
What are demand charges and why do they matter for charging stations?+
Commercial electricity is billed in two parts: energy consumed, and a monthly demand charge on your sanctioned or maximum recorded load in kVA regardless of use. A 60 kW charger obliges you to contract around 70 kVA every month whether you sell 400 units a day or four. Expressed per unit sold, that works out around ₹6.40 per kWh at 5 per cent utilisation against a ₹10 margin, falling to about ₹1.60 at 20 per cent.
How does a battery buffer improve charging station economics?+
It decouples the power the vehicle sees from the power the grid supplies. A 60 kW charger at 10 per cent utilisation moves 144 kWh a day, which a 20 kW connection can deliver into a battery over eight hours. Sanctioned load falls from roughly 70 kVA to 25, cutting the largest fixed cost by about two-thirds, the connection capital cost often falls sharply, and sites the local network could never sanction become buildable.
Does the PM E-DRIVE subsidy make a charging station viable?+
It improves the arithmetic without changing the business. Support of up to half the capital cost for public fast chargers, conditional on roughly 95 per cent uptime and OCPP compliance, pulls payback in by years. But it does not create traffic at your site, pay next month’s demand charge or service your debt — a site that cannot cover fixed operating costs from gross margin simply loses money on a smaller investment. Budget for the uptime condition too, since it obliges spares, a technician and monitoring.
Thinking about upgrading?
Talk to our team about the right pack for your vehicle, and about EMI options that keep the monthly outgo close to what you already spend.
Get in touch