Battery Storage Overtook Pumped Hydro. It Did Not Do It on Price.
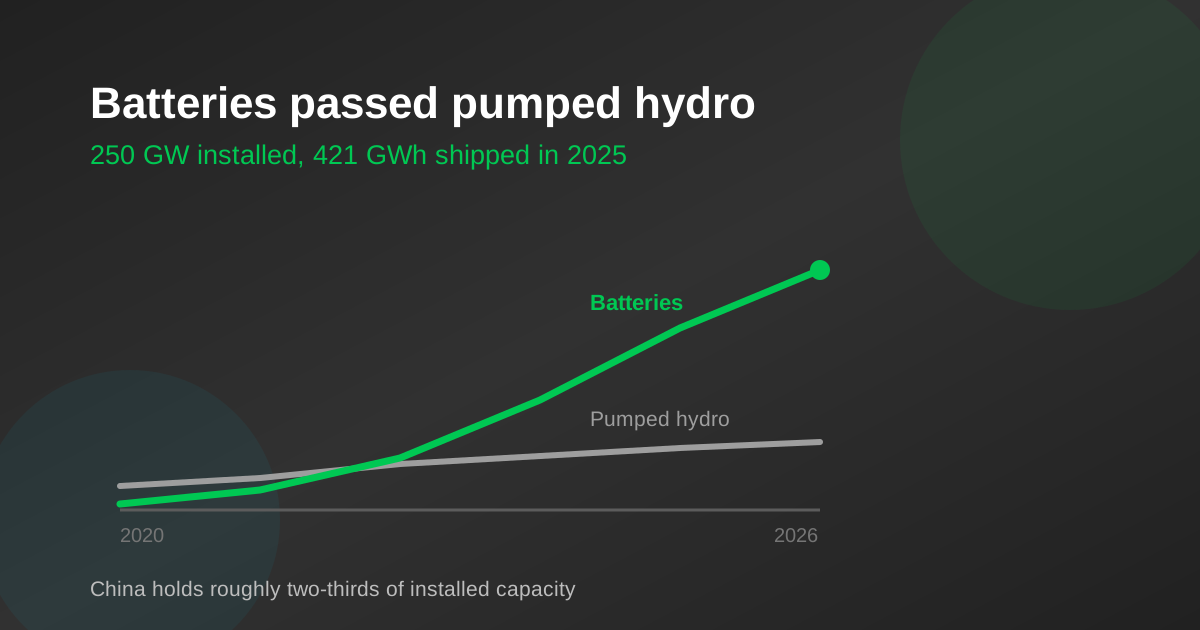
Global capacity passed 250 GW in 2025 and shipments rose about 75 per cent to 421 GWh, with roughly 158 GW forecast for 2026. Batteries beat a cheaper technology by being buildable where the grid actually hurts — and China holds about two-thirds of it.
Published: 24 August 2026
Grid storage · 8 min read
Where things stand
Written 24 August 2026. Deployment figures are forecasts and shipment estimates from market trackers, not audited installation data, and different houses count differently.
Battery storage crossed a threshold last year that had been predicted for a decade and still arrived early. Global installed battery storage capacity passed 250 GW in 2025 and overtook pumped hydro — the technology that had been the world’s answer to storing electricity since the 1890s.
The shipment numbers underneath that are steeper still. Global BESS shipments rose about 75.5 per cent in 2025 to roughly 421 GWh, with something near 600 GWh projected for 2026. BloombergNEF has forecast around 158 GW of storage deployments globally in 2026, with additions running above 130 GW and 350 GWh led by China, the United States, the United Kingdom, Australia and Germany.
Why pumped hydro losing the crown is the interesting part
The comparison is not just a milestone for a press release. Pumped hydro and batteries fail and scale in opposite ways, and swapping one for the other changes what a grid can be planned around.
A pumped hydro scheme is enormous, extremely long-lived, cheap per unit of energy stored, and effectively impossible to site. It needs two reservoirs at different heights, a decade of permitting, and a geography that either exists or does not. You cannot build one near the load; you build it where the mountain is.
A battery installation is none of those things. It is modular, it is built in months rather than a decade, it degrades, it is expensive per kilowatt-hour of energy — and it can be placed at the exact substation that has a problem. That last property is why batteries overtook a cheaper technology: siting flexibility turned out to be worth more than cost per kilowatt-hour.
Batteries did not win by becoming cheaper than pumped hydro per kilowatt-hour. They won by being buildable where the grid actually hurts, and by arriving inside a planning horizon that a utility can commit to.
The concentration problem
One number should temper any celebration. China accounts for something on the order of two-thirds of the world’s installed battery storage capacity, and Chinese manufacturers supply the overwhelming majority of the cells that go into everyone else’s projects.
So the global storage boom is, in practice, one country’s industrial capacity being deployed at home and exported everywhere else. That is not a criticism of the technology or of the buyers — it is the reason costs fell far enough for any of this to happen. But it does mean the storage build-out inherits a supply chain concentration that every importing country is now trying to reduce, generally without much success so far. We have written separately on how that position was built and on what catching up would actually require.
Reading these numbers honestly
- •GW and GWh are not interchangeable, and the gap between them is the story. A market moving from two-hour to four-hour systems adds far more GWh than GW, and the two figures diverge accordingly. Any comparison that mixes them is wrong.
- •Shipments are not installations. Cells shipped in a year include inventory, projects still in construction and systems that will not energise until the following year. Shipment growth consistently overstates deployment growth in a rising market.
- •Forecasts from different trackers are not the same measurement. Some count grid-scale only, some include commercial and residential, some count contracted pipeline. Compare a source with itself over time rather than with a rival.
- •National totals hide the constraint. Most grids do not need storage in general; they need it at particular nodes at particular hours. Aggregate GW says nothing about whether it landed where the congestion is.
What it changes in India
India is a small share of these totals and a large share of the growth intention. The practical consequence of a global market this size is not the headline — it is that the equipment, the engineering practice and the financing templates now exist in volume, which is exactly what a market entering its own build-out needs to borrow.
The domestic tender wave is covered in our note on the VGF expansion and the 2026 tender pipeline. The caution that goes with it is the same one as ever: a global boom competing for the same cells is not an unambiguous benefit to a buyer sitting in the queue behind it.
Sources
Reporting this piece draws on. Figures were correct as published; scheme terms and commodity prices move.
- BloombergNEF forecasts 158GW of global energy storage deployments in 2026Energy-Storage.News
- Battery Storage Capacity: Record Growth and Trends in 2026Energy Industry Review
- Energy Storage Outlook: The expanding role of BESS in global energy systemsRystad Energy
Frequently asked questions
Has battery storage really overtaken pumped hydro?+
On installed capacity, yes. Global battery storage passed 250 GW in 2025 and moved ahead of pumped hydro, which had been the world’s dominant electricity storage technology since the 1890s. Note that this is a power comparison — pumped hydro still holds a very large share of stored energy, because its typical duration is far longer.
Why did batteries beat a cheaper technology?+
Siting flexibility beat cost per kilowatt-hour. A pumped hydro scheme needs two reservoirs at different heights, a decade of permitting and a geography that either exists or does not, so it gets built where the mountain is rather than where the load is. A battery is modular, built in months, and can be placed at the exact substation with the problem. That turned out to be worth more than being cheap per unit of energy stored.
How big is the global storage market now?+
Shipments rose about 75.5 per cent in 2025 to roughly 421 GWh, with something near 600 GWh projected for 2026. BloombergNEF has forecast around 158 GW of deployments globally in 2026, with additions running above 130 GW and 350 GWh, led by China, the United States, the United Kingdom, Australia and Germany. Different trackers count differently, so compare a source with itself over time rather than across houses.
How concentrated is the storage market?+
Heavily. China accounts for roughly two-thirds of installed battery storage capacity and Chinese manufacturers supply the large majority of cells going into everyone else’s projects. That concentration is the reason costs fell far enough for the boom to happen, and it is also the supply chain risk every importing country is now trying to reduce.
Want this applied to your own numbers?
Every solution page carries a calculator that shows its own arithmetic — storage savings, lithium against lead-acid, and home pack sizing.
Get in touch